


For online retailers, the difference between thriving and merely surviving often comes down to how effectively you analyse and act on your data. The businesses capturing the largest market share aren’t just monitoring their traffic—they’re extracting strategic insights that drive revenue growth.
In our latest guide, we share the most valuable ecommerce traffic statistics, focusing on metrics that directly impact your bottom line. Whether you’re looking to optimise conversion pathways, enhance mobile performance, or maximise the value of your existing traffic, these insights will help you make strategic decisions that strengthen your competitive position.
Key Takeaways
- Diversify your traffic sources strategically, focusing on organic search, paid channels, social media, and direct traffic to create a resilient customer acquisition mix.
- Mobile optimisation is no longer optional with 65% of ecommerce traffic coming from mobile devices and conversion rates improving dramatically with faster page speeds and thumb-friendly designs.
- Customer journey analysis reveals most purchases occur either on the first visit or after 3-4 interactions, with returning visitors typically showing 15-30% higher average order values.
- Social commerce integration has become essential as platforms evolve from awareness channels to direct sales drivers, with social proof elements boosting on-site conversion rates by up to 22%.
- Effective data utilisation requires proper analytics configuration with enhanced ecommerce tracking, custom dimensions, and cross-device attribution to quantify opportunities and drive revenue growth.
Global ecommerce market trends driving traffic in 2025
The global ecommerce market continues to evolve at a remarkable pace, shaped by changing consumer preferences, technological advancements, and increased internet penetration worldwide. Understanding these broader market trends provides essential context for interpreting your own ecommerce traffic statistics.
Worldwide ecommerce growth
Retail ecommerce sales are expected to account for nearly 25% of total retail sales worldwide by the end of 2025, representing a significant shift in consumer shopping habits. Several factors are fueling this growth:
- The number of online shoppers continues to rise globally, with an estimated 2.77 billion people making online purchases regularly in 2025. This expansion is particularly notable in emerging markets where increased internet penetration creates new opportunities for online retailers.
- Mobile commerce has become the dominant force in the ecommerce landscape, with mobile ecommerce sales accounting for over 70% of all ecommerce revenue in many markets. The convenience of smartphone shopping has transformed consumer behaviour, making mobile-friendly sites essential for success.
- Social commerce sales have seen explosive growth, with platforms like Instagram, TikTok, and Facebook becoming significant drivers of ecommerce traffic. In 2025, social commerce is projected to generate over $1.2 trillion in global sales, highlighting the increasing integration of social media and online shopping.
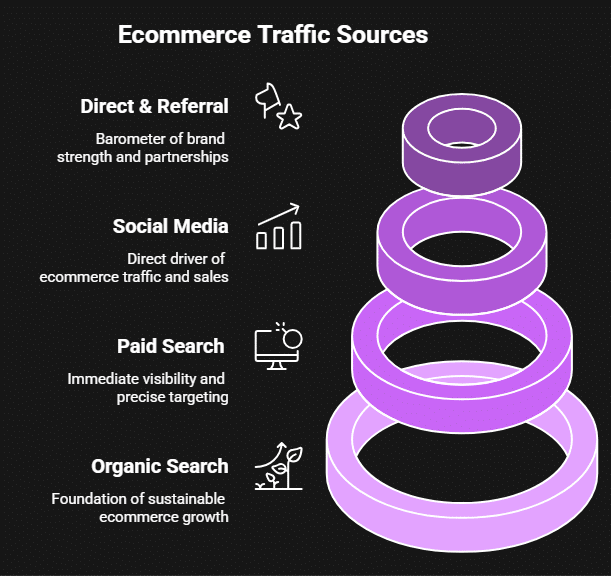
Essential traffic sources for ecommerce websites
Organic search traffic
Organic search remains the foundation of sustainable ecommerce growth, typically accounting for 35-45% of total traffic to ecommerce sites. This traffic source is particularly valuable because it represents users actively seeking products or information related to your business.
Key performance indicators for organic search include:
Keyword rankings: Tracking your position for high-intent commercial keywords is essential. Research shows that the top three search results capture approximately 75% of all clicks, making visibility in these positions critical for driving significant traffic.
Organic click-through rate (CTR): The percentage of searchers who click on your listing after seeing it in search results. CTRs vary by position, but improving your meta titles and descriptions can significantly increase clicks even without ranking improvements.
Landing page performance: Monitoring which pages attract the most organic traffic helps you understand what content resonates with searchers and which pages deserve additional optimisation efforts.
At Firewire Digital, we help online businesses implement comprehensive SEO strategies that focus on driving qualified traffic with strong purchase intent. Our data-driven approach has helped our ecommerce clients increase their organic traffic, driving online sales and repeat purchases.
Paid search and shopping traffic
Paid channels offer immediate visibility and precise targeting capabilities that complement organic efforts. For established ecommerce businesses, paid search typically accounts for 15-25% of total site traffic, with conversion rates often higher than other channels due to the specific intent signals these platforms capture.
Important metrics for paid traffic include:
Cost per click (CPC): The average amount you pay for each click on your ads. CPCs vary widely by industry, with competitive sectors like consumer electronics often seeing rates of $1.50 or higher.
Return on ad spend (ROAS): The revenue generated for every dollar spent on advertising. Successful ecommerce businesses typically aim for ROAS of 400% or higher to ensure profitability.
Quality Score: Google’s assessment of your ad quality and relevance, which directly impacts your ad costs and positioning. Improving your Quality Score through better landing pages and ad relevance can significantly reduce your acquisition costs.
Social media traffic
Social media platforms have evolved from brand awareness channels to direct drivers of ecommerce traffic and sales. With social commerce sales projected to reach $1.2 trillion globally in 2025, these channels now form a critical component of the customer journey shopping online.
Each social media channel tends to serve different purposes in the ecommerce ecosystem:
Instagram and Pinterest excel at product discovery and inspiration, generating traffic earlier in the buying journey with visually appealing content.
Facebook remains powerful for remarketing and community building, often driving visitors with higher purchase intent.
TikTok has emerged as a major traffic driver, particularly for brands targeting younger demographics. Its immersive short-form video format proves highly effective for product demonstrations.
Direct and referral traffic
Direct traffic—visitors who type your URL directly or use a bookmark—serves as a barometer of brand strength. As your brand recognition grows, you should see your percentage of direct traffic increase proportionally.
Referral traffic comes from links on other websites and can include:
Content partnerships: Collaborations with publishers, influencers, and industry websites that link to your products or content.
Affiliate marketing: Performance-based marketing where partners earn commission for traffic or sales they generate.
PR mentions: Media coverage and public relations efforts that include links to your online store.
Monitoring the growth and conversion performance of each traffic source allows you to allocate your marketing resources more effectively, focusing on the channels that deliver the strongest return on investment for your specific business model.
User behaviour metrics for ecommerce sites
Beyond basic traffic volume, understanding how visitors interact with your ecommerce store provides crucial insights for optimisation. These engagement metrics help you identify both opportunities and obstacles in the customer journey.
Engagement metrics
The quality of traffic is often more important than quantity alone. Key engagement metrics to track include:
Average session duration: The typical visitor spends 2-3 minutes on ecommerce sites. Longer sessions generally indicate higher engagement and interest in your products.
Pages per session: The average visitor views 3.5 pages per ecommerce session. Higher numbers suggest effective internal linking and engaging content, while lower figures may indicate navigation problems or poor content quality.
Bounce rate: Ecommerce sites typically see bounce rates between 35-45%. Higher rates often signal issues with page loading speed, design, or content relevance to the traffic being driven.
Scroll depth: Measuring how far users scroll down your pages helps assess content engagement. Most visitors view only the top 50% of content on ecommerce product pages.
Shopping behaviour analysis
Monitoring how visitors interact with your product catalogue and shopping features reveals valuable insights:
Product view rate: The percentage of visitors who view at least one product page during their session. Rates below 40% may indicate issues with navigation or search functionality.
Add-to-cart rate: Typically 8-10% of ecommerce visitors add products to their cart. Significant deviations from this benchmark may signal pricing issues, insufficient product information, or poor product-market fit.
Cart abandonment rate: The global average hovers around 70%, with complex checkout processes and unexpected costs being the primary culprits.
Checkout completion rate: On average, only 30% of users who begin checkout actually complete their purchase. Each additional step in the checkout process can reduce completion rates by 10%.
Customer journey analysis
Understanding the paths visitors take through your site helps optimise the overall experience:
Entry pages: Identifying your most common landing pages helps prioritise optimisation efforts. For many ecommerce sites, up to 60% of organic search traffic lands on product or category pages rather than the homepage.
Exit pages: Pages with high exit rates may have usability issues or fail to clearly indicate visitors’ next steps.
Conversion paths: Analysing the typical journeys that lead to purchases helps you identify critical touchpoints and potential bottlenecks.
By thoroughly analysing these user behaviour metrics, you can pinpoint specific areas for improvement and prioritise optimisation efforts that will have the greatest impact on your conversion rates and overall ecommerce revenue.
New vs. returning visitor performance
The balance between new and returning visitors provides insights into your brand’s customer lifecycle:
New visitors typically convert at rates 2-3 times lower than returning visitors but represent essential top-of-funnel growth.
Returning visitors not only convert at higher rates but also typically have a 15-30% higher average order value than first-time purchasers.
Visit frequency patterns: Most ecommerce purchases occur either on the first visit (immediate need fulfilment) or after 3-4 interactions with your brand (consideration phase purchases).
Healthy ecommerce businesses generally maintain a balance of 60-70% new visitors and 30-40% returning visitors, though this ratio varies based on business model and market maturity.
Mobile ecommerce statistics and optimisation
As mobile commerce continues to dominate ecommerce traffic, understanding mobile-specific metrics becomes increasingly important for online retailers seeking to maximise conversions.
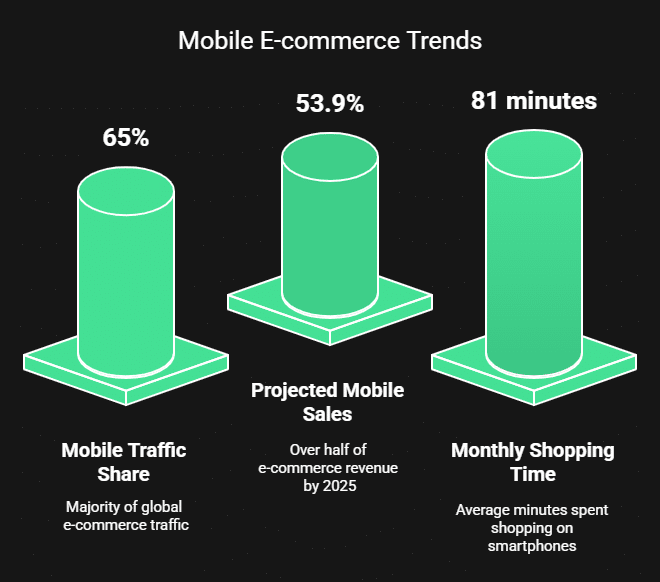
Current mobile commerce trends
Mobile ecommerce statistics reveal several significant trends that are reshaping online retail:
Mobile traffic share has reached approximately 65% of all ecommerce website traffic globally, though conversion rates still lag behind desktop in many industries.
Mobile e-commerce sales are projected to account for 53.9% of all e-commerce revenue by the end of 2025, representing $4.05 trillion in global sales.
Smartphone users spend an average of 81 minutes per month shopping on their devices, with this figure continuing to increase year over year.
Mobile shopping peaks during commuting hours and evening leisure time, creating distinct usage patterns that differ from desktop traffic.
Mobile user experience factors
Several key factors significantly impact mobile conversion rates:
Mobile page speed remains critical, with a seven-second load time increasing bounce rates by 113% compared to sites loading in 1-2 seconds.
Mobile checkout optimisation can reduce abandonment by up to 35%. Key improvements include simplified forms, digital wallet integration, and progress indicators.
Mobile-friendly navigation with prominent search functionality improves product discovery. Sites with easily accessible search functions see 27% higher conversion rates on mobile devices.
Thumb-friendly design that places key elements within easy reach of one-handed operation can increase engagement by 15-20%.
Social commerce statistics and integration
Social commerce has evolved from a supplementary channel to a primary driver of ecommerce traffic and sales. Understanding how social media platforms influence the shopping journey helps online retailers develop more effective omnichannel strategies.
Social commerce growth trends
The integration of shopping features into social media channels has accelerated dramatically:
Social commerce sales are projected to reach $1.2 trillion globally by 2025, representing 16.7% of total ecommerce spending.
Instagram Shopping users spend an average of 8 minutes per session browsing products, significantly higher than typical mobile site engagement.
TikTok commerce has seen the fastest growth, with a 553% increase in shopping-related content engagement over the past year.
Facebook Marketplace continues to expand beyond peer-to-peer selling, with increased integration of business sellers driving significant traffic to external ecommerce sites.
Social proof and user-generated content
Leveraging social engagement to enhance on-site conversion rates has become essential:
Customer photos on product pages can increase conversion rates by 22% compared to professional images alone.
Instagram feed integration on ecommerce sites increases average time on page by 28% and improves conversion rates by up to 15%.
Social share counts displayed prominently can increase conversion rates by 5-7% through enhanced social proof.
Influencer content repurposed on product pages increases conversion rates by an average of 18% across fashion and beauty categories.
Successful online retailers are increasingly blurring the lines between social platforms and their own ecommerce sites, creating seamless experiences that leverage the strengths of each channel to drive conversions.
Implementing data-driven decision making
Effective use of ecommerce traffic statistics requires more than monitoring—it requires an organised approach to regular analysis and implementation. We recommend setting up the following foundational metrics, which will allow you to interrogate your data easily and extract the key findings.
Analytics setup and configuration
Proper measurement forms the foundation of data-driven ecommerce:
- Enhanced ecommerce tracking provides detailed insights into shopping behaviour, allowing you to identify specific friction points in the purchase journey.
- Implementing custom dimensions helps segment traffic based on factors relevant to your business, such as customer type, product category interest, or marketing campaign exposure.
- Goal and event tracking ensures you capture important micro-conversions, such as email sign-ups, wishlist additions, and product views that precede purchases.
- Cross-device and cross-channel attribution provides a more complete picture of the customer journey, helping you understand the true impact of each marketing touchpoint.
Actionable reporting for stakeholders
Not everyone in your organisation will be across the details; however, being able to effectively communicate the topline findings and actionable items out of this will allow you to bring them on the marketing journey as well. Consider the following when reporting to stakeholders:
- Executive dashboards should focus on key business metrics like revenue, conversion rate, and customer acquisition cost rather than vanity metrics.
- Segment-specific analysis highlights performance variations across different traffic sources, device types, and customer segments.
- Opportunity quantification translates performance gaps into potential revenue impact, helping prioritise investment decisions.
- Competitive benchmarking provides context for your performance metrics, identifying areas where you lead or lag industry standards.
At Firewire Digital, we can help you implement measurement frameworks that drive continuous improvement. We work alongside you to develop a data-driven approach that ensures marketing investments focus on the initiatives most likely to deliver meaningful revenue growth.
Leveraging ecommerce traffic statistics for growth
The above approaches will become even more important as competition intensifies and customer expectations continue to evolve. The ecommerce businesses that thrive will be those that most effectively translate traffic insights into strategic action.
At Firewire Digital, we specialise in helping established ecommerce businesses transform their traffic into revenue. If you’re ready to maximise the value of your traffic, contact our team today. We’ll discuss your specific challenges and how our proven approach can help your business achieve sustainable growth in the competitive ecommerce landscape.